An Empirical Comparison of Meta- and Mega-Analysis With Data From the ENIGMA Obsessive-Compulsive Disorder Working Group
 Premika S. W. Boedhoe1,2
  Martijn W. Heymans3
  Lianne Schmaal4,5
  Yoshinari Abe6 Pino Alonso7,8,9 Stephanie H. Ameis10,11
  Alan Anticevic12
  Paul D. Arnold13,14
  Marcelo C. Batistuzzo15
  Francesco Benedetti16 Jan C. Beucke17 Irene Bollettini16 Anushree Bose18 Silvia Brem19 Anna Calvo20 Rosa Calvo8,21
  Yuqi Cheng22
  Kang Ik K. Cho23
  Valentina Ciullo24,25 Sara Dallaspezia16
  Damiaan Denys26,27
  Jamie D. Feusner28
  Kate D. Fitzgerald29 Jean-Paul Fouche30
  Egill A. Fridgeirsson26 Patricia Gruner12
  Gregory L. Hanna29 Derrek P. Hibar31
  Marcelo Q. Hoexter15
  Hao Hu32 Chaim Huyser33,34 Neda Jahanshad35
  Anthony James36 Norbert Kathmann17
  Christian Kaufmann17
  Kathrin Koch37,38
  Jun Soo Kwon39,40 Luisa Lazaro8,21,41,42
  Christine Lochner43
  Rachel Marsh44,45 Ignacio Martínez-Zalacaín7
  David Mataix-Cols46
  José M. Menchón7,8,9 Luciano Minuzzi47
  Astrid Morer8,21,41
  Takashi Nakamae6
  Tomohiro Nakao48 Janardhanan C. Narayanaswamy18 Seiji Nishida6
  Erika L. Nurmi28
  Joseph O'Neill28 John Piacentini28
  Fabrizio Piras24
  Federica Piras24
  Y. C. Janardhan Reddy18 Tim J. Reess37,38
  Yuki Sakai6,49
  Joao R. Sato50 H. Blair Simpson44,51
  Noam Soreni52
  Carles Soriano-Mas7,8,53
  Gianfranco Spalletta24,54
  Michael C. Stevens55,56 Philip R. Szeszko57,58 David F. Tolin55,59
  Guido A. van Wingen26 Ganesan Venkatasubramanian18
  Susanne Walitza19
  Zhen Wang32,60
  Je-Yeon Yun35,39 ENIGMA-OCD Working-Group†
  Paul M. Thompson31
  Dan J. Stein30
  Odile A. van den Heuvel1,2*‡ Jos W. R. Twisk3*‡
- 1Department of Psychiatry, Amsterdam University Medical Centers (UMC), Vrije Universiteit Amsterdam, Amsterdam Neuroscience, Amsterdam, Netherlands
- 2Department of Anatomy and Neurosciences, Amsterdam University Medical Centers, Vrije Universiteit Amsterdam, Amsterdam Neuroscience, Amsterdam, Netherlands
- 3Department of Epidemiology and Biostatistics, Amsterdam Public Health Research Institute, Amsterdam University Medical Centers, Vrije Universiteit Amsterdam, Amsterdam, Netherlands
- 4Orygen, The National Centre of Excellence in Youth Mental Health, Melbourne, VIC, Australia
- 5Centre for Youth Mental Health, The University of Melbourne, Melbourne, VIC, Australia
- 6Department of Psychiatry, Graduate School of Medical Science, Kyoto Prefectural University of Medicine, Kyoto, Japan
- 7Department of Psychiatry, Bellvitge University Hospital, Bellvitge Biomedical Research Institute-IDIBELL, L'Hospitalet de Llobregat, Barcelona, Spain
- 8Centro de Investigación Biomèdica en Red de Salud Mental (CIBERSAM), Barcelona, Spain
- 9Department of Clinical Sciences, University of Barcelona, Barcelona, Spain
- 10Department of Psychiatry, Faculty of Medicine, The Centre for Addiction and Mental Health, The Margaret and Wallace McCain Centre for Child, Youth and Family Mental Health, Campbell Family Mental Health Research Institute, University of Toronto, Toronto, ON, Canada
- 11The Hospital for Sick Children, Centre for Brain and Mental Health, Toronto, ON, Canada
- 12Department of Psychiatry, Yale University School of Medicine, New Haven, CT, United States
- 13Mathison Centre for Mental Health Research and Education, Cumming School of Medicine, Hotchkiss Brain Institute, University of Calgary, Calgary, AB, Canada
- 14Department of Psychiatry, Cumming School of Medicine, University of Calgary, Calgary, AB, Canada
- 15Departamento de Psiquiatria, Faculdade de Medicina, Instituto de Psiquiatria, Universidade de São Paulo, São Paulo, Brazil
- 16Division of Neuroscience, Psychiatry and Clinical Psychobiology, Scientific Institute Ospedale San Raffaele, Milan, Italy
- 17Department of Psychology, Humboldt-Universität zu Berlin, Berlin, Germany
- 18Obsessive-Compulsive Disorder (OCD) Clinic Department of Psychiatry National Institute of Mental Health and Neurosciences, Bangalore, India
- 19Department of Child and Adolescent Psychiatry and Psychotherapy, Psychiatric Hospital, University of Zurich, Zurich, Switzerland
- 20Magnetic Resonance Image Core Facility, IDIBAPS (Institut d'Investigacions Biomèdiques August Pi i Sunyer), Barcelona, Spain
- 21Department of Child and Adolescent Psychiatry and Psychology, Hospital Clínic Universitari, Institute of Neurosciences, Barcelona, Spain
- 22Department of Psychiatry, First Affiliated Hospital of Kunming Medical University, Kunming, China
- 23Institute of Human Behavioral Medicine, SNU-MRC, Seoul, South Korea
- 24Laboratory of Neuropsychiatry, Department of Clinical and Behavioral Neurology, IRCCS Santa Lucia Foundation, Rome, Italy
- 25Neurosciences, Psychology, Drug Research and Child Health (NEUROFARBA), University of Florence, Florence, Italy
- 26Department of Psychiatry, Amsterdam Neuroscience, Amsterdam University Medical Centers, University of Amsterdam, Amsterdam, Netherlands
- 27Netherlands Institute for Neuroscience, Royal Netherlands Academy of Arts and Sciences, Amsterdam, Netherlands
- 28Department of Psychiatry and Biobehavioral Sciences, University of California, Los Angeles, Los Angeles, CA, United States
- 29Department of Psychiatry, University of Michigan, Ann Arbor, MI, United States
- 30MRC Unit on Risk & Resilience in Mental Disorders, Department of Psychiatry, University of Cape Town, Cape Town, South Africa
- 31Imaging Genetics Center, Keck School of Medicine of the University of Southern California, Mark and Mary Stevens Neuroimaging and Informatics Institute, Marina del Rey, CA, United States
- 32Shanghai Mental Health Center Shanghai Jiao Tong University School of Medicine, Shanghai, China
- 33De Bascule, Academic Center for Child and Adolescent Psychiatry, Amsterdam, Netherlands
- 34Department of Child and Adolescent Psychiatry, Amsterdam University Medical Centers, University of Amsterdam, Amsterdam, Netherlands
- 35Yeongeon Student Support Center, Seoul National University College of Medicine, Seoul, South Korea
- 36Department of Psychiatry, Oxford University, Oxford, United Kingdom
- 37Department of Neuroradiology, Klinikum rechts der Isar, Technische Universität München, Munich, Germany
- 38TUM-Neuroimaging Center (TUM-NIC) of Klinikum rechts der Isar, Technische Universität München, Munich, Germany
- 39Department of Psychiatry, Seoul National University College of Medicine, Seoul, South Korea
- 40Department of Brain and Cognitive Sciences, Seoul National University College of Natural Sciences, Seoul, South Korea
- 41Institut d'Investigacions Biomèdiques August Pi i Sunyer (IDIBAPS), Barcelona, Spain
- 42Department of Medicine, University of Barcelona, Barcelona, Spain
- 43SU/UCT MRC Unit on Anxiety and Stress Disorders, Department of Psychiatry, University of Stellenbosch, Stellenbosch, South Africa
- 44Columbia University Medical College, Columbia University, New York, NY, United States
- 45The New York State Psychiatric Institute, New York, NY, United States
- 46Department of Clinical Neuroscience, Centre for Psychiatry Research, Karolinska Institutet, Stockholm, Sweden
- 47Mood Disorders Clinic, St. Joseph's HealthCare, Hamilton, ON, Canada
- 48Department of Neuropsychiatry, Graduate School of Medical Sciences, Kyushu University, Fukuoka, Japan
- 49ATR Brain Information Communication Research Laboratory Group, Kyoto, Japan
- 50Center for Mathematics, Computing and Cognition, Universidade Federal do ABC, Santo Andre, Brazil
- 51Center for OCD and Related Disorders, New York State Psychiatric Institute, New York, NY, United States
- 52Anxiety Treatment and Research Center, St. Joseph's HealthCare, Hamilton, ON, Canada
- 53Department of Psychobiology and Methodology of Health Sciences, Universitat Autònoma de Barcelona, Barcelona, Spain
- 54Beth K. and Stuart C. Yudofsky Division of Neuropsychiatry, Department of Psychiatry and Behavioral Sciences, Baylor College of Medicine, Houston, TX, United States
- 55Yale University School of Medicine, New Haven, CT, United States
- 56Clinical Neuroscience and Development Laboratory, Olin Neuropsychiatry Research Center, Hartford, CT, United States
- 57Icahn School of Medicine at Mount Sinai, New York, NY, United States
- 58James J. Peters VA Medical Center, Bronx, NY, United States
- 59Institute of Living/Hartford Hospital, Hartford, CT, United States
- 60Shanghai Key Laboratory of Psychotic Disorders, Shanghai, China
Objective: Brain imaging communities focusing on different diseases have increasingly started to collaborate and to pool data to perform well-powered meta- and mega-analyses. Some methodologists claim that a one-stage individual-participant data (IPD) mega-analysis can be superior to a two-stage aggregated data meta-analysis, since more detailed computations can be performed in a mega-analysis. Before definitive conclusions regarding the performance of either method can be drawn, it is necessary to critically evaluate the methodology of, and results obtained by, meta- and mega-analyses.
Methods: Here, we compare the inverse variance weighted random-effect meta-analysis model with a multiple linear regression mega-analysis model, as well as with a linear mixed-effects random-intercept mega-analysis model, using data from 38 cohorts including 3,665 participants of the ENIGMA-OCD consortium. We assessed the effect sizes and standard errors, and the fit of the models, to evaluate the performance of the different methods.
Results: The mega-analytical models showed lower standard errors and narrower confidence intervals than the meta-analysis. Similar standard errors and confidence intervals were found for the linear regression and linear mixed-effects random-intercept models. Moreover, the linear mixed-effects random-intercept models showed better fit indices compared to linear regression mega-analytical models.
Conclusions: Our findings indicate that results obtained by meta- and mega-analysis differ, in favor of the latter. In multi-center studies with a moderate amount of variation between cohorts, a linear mixed-effects random-intercept mega-analytical framework appears to be the better approach to investigate structural neuroimaging data.
Introduction
Data pooling across individual studies has the potential to significantly accelerate progress in brain imaging (Van Horn et al., 2001), as demonstrated by large-scale neuroimaging initiatives, such as the ENIGMA (Enhanced NeuroImaging Genetics through Meta-Analysis) consortium (Thompson et al., 2014). The most immediate advantage of data pooling is increased power due to the larger number of subjects available for analysis. Data pooling across multiple centers worldwide can also lead to a more heterogeneous and potentially representative participant sample. Large-scale studies are well-powered to distinguish consistent, generalizable findings from false positives that emerge from smaller-sampled studies. The participation of many experts may also lead to a more balanced interpretation, wider endorsement of the conclusions by others, and greater dissemination of results (Stewart, 1995).
An aggregate data meta-analysis is the most conventional approach, where summary results, such as effect size estimates, standard errors, and confidence intervals, are extracted from primary published studies and then synthesized to estimate the overall effect for all the studies combined (de Bakker et al., 2008). This approach is relatively quick and inexpensive, but often prone to selective reporting in primary studies, publication bias, low power to detect interaction effects and lack of harmonization of data processing and analysis methods among the included studies. To overcome these issues, collaborative groups are increasingly collating individual-participant data (IPD) from multiple studies to jointly analyze the individual-level data in a meta-analysis of IPD (Stewart, 1995). The IPD approach allows standardization of processing protocols and statistical analyses, culminating in study results not provided by the individual publications. This approach also allows modeling of interaction effects within the studies. Given these advantages, the IPD approach is currently the gold standard.
There are two competing statistical approaches for IPD meta-analysis: a two-stage or a one-stage approach (Thomas et al., 2014). In the two-stage approach, the first step includes analyzing the IPD from each study separately, to obtain aggregate (summary) data (e.g., effect size estimates and confidence intervals). The second step includes using standard meta-analytical techniques, such as a random effects meta-analysis model. The alternative one-stage approach analyzes all IPD in one statistical model while accounting for clustering among patients in the same study, to estimate an overall effect. Throughout this manuscript, the one-stage IPD approach is referred to as mega-analysis, while the two-stage approach is referred to as meta-analysis.
Some methodologists claim that a mega-analysis can be superior to meta-analysis. The comprehensive evaluation of missing data and greater flexibility in the control of confounders at the level of individual patients and specific studies are significant advantages of a mega-analytical approach. Mega-analyses have also been recommended as they avoid the assumptions of within-study normality and known within-study variances, which are especially problematic with smaller samples (Debray et al., 2013). Despite these advantages, mega-analysis requires homogeneous data sets and the establishment of a common centralized database. The latter criterion is time-consuming since cleaning, checking, and re-formatting the various data sets adds to the time and costs of performing mega-analyses. Obtaining IPD may also be challenging and limited by the terms of the informed consent or other data sharing constraints within each study. These are the main reasons why researchers often prefer meta-analysis using summary statistics. Additionally, meta-analysis allows for analyses of individual studies to account for local population substructure and study-specific covariates that may be better dealt with within each study. While each method has its own advantages and limitations, researchers still debate which method is superior for tackling different types of questions [see (Stewart and Tierney, 2002; Burke et al., 2017) for reviews on advantages and disadvantages of each approach].
Brain imaging communities focusing on different diseases have started collaborating to perform well-powered meta- and mega-analyses. In the largest studies to date on the neural correlates of OCD, the authors of the ENIGMA-OCD consortium (Boedhoe et al., 2017a, 2018) conducted a mega-analysis, pooling individual participant-level data from more than 25 research institutes worldwide, as well as a meta-analysis by combining summary statistic results from the independent sites. The meta- and mega-analyses revealed comparable findings of subcortical abnormalities in OCD (Boedhoe et al., 2017a), but the mega-analytical approach seemed more sensitive for detecting subtle cortical abnormalities (Boedhoe et al., 2018). Before definitive conclusions regarding the performance of either method can be drawn, it is necessary to critically evaluate the results obtained by various approaches for meta- and mega-analyses.
Herein, we use data from the ENIGMA-OCD consortium to compare results obtained by meta- and mega-analyses. Specifically, we applied the inverse variance weighted random-effect meta-analysis model and the multiple linear regression mega-analysis model as used in the aforementioned studies (Boedhoe et al., 2017a, 2018). In addition, we compared findings from these models to those detected with a linear mixed-effects random-intercept mega-analytical model. Effect sizes and standard error estimates, and (where possible) model fit were used to evaluate which of the methods performs best.
Methods
Samples
The ENIGMA-OCD working group includes 38 data sets from 27 international research institutes with neuroimaging and clinical data from OCD patients and typically developing healthy control subjects, including both children and adults (Boedhoe et al., 2018). We defined adults as individuals aged ≥18 years and children as individuals aged < 18 years. The split at the age of 18 followed from a natural selection of the age ranges used in these samples, as most samples used the age of 18 years as a cut-off for inclusion. Because our previous findings and the literature suggest differential effects between pediatric and adult samples, we performed separate analyses for adult and pediatric data [for demographics and further details on the samples, see (Boedhoe et al., 2018)]. In total, we analyzed data from 3,665 participants including 1,905 OCD patients (407 children and 1,498 adults) and 1,760 control participants (324 children and 1,436 adults). All local institutional review boards permitted the use of measures extracted from the coded data for analyses.
Image Acquisition and Processing
Structural T1-weighted brain MRI scans were acquired and processed locally. For image acquisition parameters of each site, please see (Boedhoe et al., 2018). All cortical parcellations were performed with the fully automated segmentation software FreeSurfer, version 5.3 (Fischl, 2012), following standardized ENIGMA protocols to harmonize analyses and quality control procedures across multiple sites (see http://enigma.usc.edu/protocols/imaging-protocols/). Segmentations of 68 (34 left and 34 right) cortical gray matter regions based on the Desikan-Killiany atlas (Desikan et al., 2006) and two whole-hemisphere measures were visually inspected and statistically evaluated for outliers [see (Boedhoe et al., 2018) for further details on quality checking].
Statistical Framework
We examined differences between OCD patients and controls across samples by performing (1) an inverse variance weighted random-effects meta-analysis model; (2) a multiple linear regression mega-analysis model; and (3) a linear mixed-effects random-intercept mega-analysis model. Each of the 70 cortical regions of interest (68 regions and two whole-hemisphere averages) served as the outcome measure and a binary indicator of diagnosis as the predictor of interest. In the meta-analysis, all cortical thickness models were adjusted for age and sex (Im et al., 2008; Westlye et al., 2010), and all cortical surface area models were corrected for age, sex, and intracranial volume (Barnes et al., 2010; Ikram et al., 2012). In the mega-analysis all models were also adjusted for scanning center (cohort). The two mega-analytical frameworks are similar, but the models account differently for clustering of data within cohorts; linear regression with a dummy variable for each cohort and linear mixed-effects models (more efficiently) with only one variance parameter. Finally, all models were fit using the restricted maximum likelihood method [REML (Harville, 1977)].
The meta- and mega-analysis encompass intrinsically different statistics, including differences in approaches for dealing with missing data. E.g., the mega-analysis estimates one restricted maximum likelihood over the entire data set. This estimation contains information of each of the other cohorts. The first stage of the meta-analysis includes the estimation of a restricted maximum likelihood per cohort, making this method more vulnerable to missing outcome data. Therefore, we descriptively compared the meta- and mega-analyses by examining the confidence intervals and standard error estimates for the effect sizes assessed. In addition, the Bayesian information criterion (BIC) were used to evaluate which of the mega-analytical models performs better. A lower BIC indicates a better model fit. Throughout the manuscript, we report p < 0.001.
Meta-Analysis
We analyzed the IPD from each study to obtain aggregated summary data. Effect size estimates were calculated using Cohen's d, computed from the t-statistic of the diagnosis indicator variable from the regression models [(Nakagawa and Cuthill, 2007), equation 10]. All regression models and effect size estimates were fitted at each site separately. A final Cohen's d effect size estimate was obtained using an inverse variance-weighted random-effect meta-analysis model in R (metafor package, version 1.9-118). This meta-analytic framework enabled us to combine data from multiple sites and take the sample size of each cohort into account by weighing individual effect size estimates for the inverse variance per cohort.
Mega-Analysis
We pooled all IPD in one statistical model to perform mega-analyses and fitted the following models:
Linear Regression
The linear regression model included cohorts as dummy variables. Effect size estimates were calculated using the Cohen's d metric computed from the t-statistic of the diagnosis indicator variable from the regression models [(Nakagawa and Cuthill, 2007), equation 10].
Linear Mixed-Effects Model – Random-Intercept
Linear mixed-effects models are extensions of linear regression models and efficiently account for clustering of data within cohorts. By adding a random-intercept for cohort, the adjustment for the clustering of data within cohorts is performed with only one (variance) parameter, which reduces the number of estimated parameters (rather than estimating the intercept of each dummy variable separately as in the linear regression model described above). We used lme4 (linear mixed-effects analysis) package in R to perform the analyses. Effect size estimates were calculated using the Cohen's d metric computed from the t-values from the mixed-effects model [(Nakagawa and Cuthill, 2007), equation 22].
Results
The results of the meta-analysis and linear regression mega-analysis have been published previously (Boedhoe et al., 2018). In this paper, we added the linear mixed-effects random-intercept mega-analysis and statistically compared the various approaches.
Meta-Analysis
No significant differences (p < 0.001) in cortical thickness were observed in adult OCD patients (N = 1,498) compared to healthy controls (N = 1,436) (Supplementary Table S1). The meta-analysis did reveal a lower surface area of the transverse temporal cortex (Cohen's d −0.17) in OCD patients (Supplementary Table S2). No group differences in cortical thickness or surface area were observed in children with OCD (N = 407) compared to control children (N = 324) (Supplementary Tables S3, S4).
Mega-Analysis
Both the linear regression (Cohen's d −0.14) and the linear mixed-effects random-intercept (Cohen's d −0.11) models revealed significantly lower cortical thickness in bilateral inferior parietal cortices in adult OCD patients (N = 1,498) compared to healthy controls (N = 1,436) (Supplementary Table S5). Both models also showed significantly lower surface area (Cohen's d −0.16) in the left transverse temporal cortex in OCD patients (Supplementary Table S6).
Both the linear regression (Cohen's d between −0.24 and −0.31) and the linear mixed-effects random-intercept (Cohen's d between −0.20 and −0.28) models revealed significantly thinner cortices in pediatric OCD patients (N = 407) compared with control children (N = 324) in the right superior parietal, left inferior parietal, and left lateral occipital cortices (Supplementary Tables S7). Neither model revealed significant group differences in cortical surface area (Supplementary Tables S8).
Comparing Meta- and Mega-Analysis
Effect Sizes
When looking at the magnitude and order of effect sizes we see the same pattern resulting from the meta-analysis and linear regression mega-analysis in both the pediatric (Supplementary Tables S3, S7) and adult (Supplementary Tables S1, S5) datasets, i.e., the magnitude and direction of effect of the effect sizes derived from the meta-analysis and linear regression mega-analysis were highly similar. The linear mixed-effects random-intercept mega-analysis also showed a similar pattern of results, but slightly smaller effect sizes (Table 1 and Supplementary Tables S5, S7).
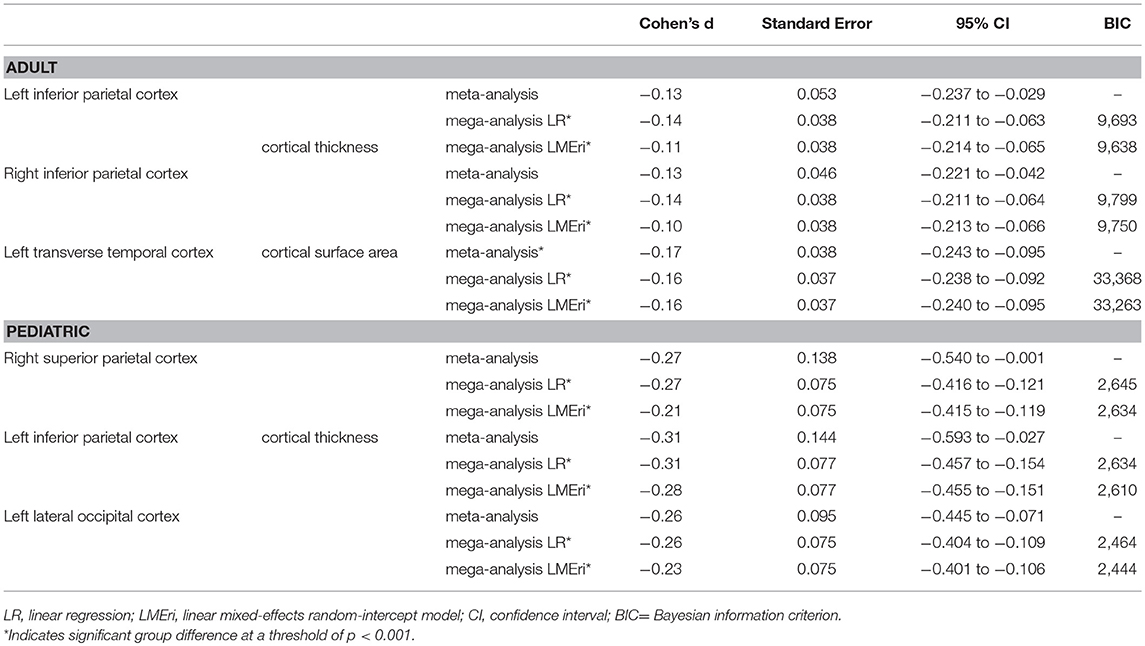
Table 1. Effect size, confidence interval, and standard error estimates, and BIC values of the main findings.
Standard Error and 95% Confidence Intervals
Overall, linear regression and linear mixed-effects random-intercept models showed lower standard errors and narrower confidence intervals than the meta-analysis. Similar standard errors and confidence intervals were found for the different mega-analysis models (Table 1 and Supplementary Tables S1–S8).
Goodness-of-Fit
The linear mixed-effects random-intercept models showed lower BIC values compared to the linear regression mega-analysis (Table 1 and Supplementary Tables S9–S12).
Discussion
The aim of this study was to evaluate different statistical methods for large-scale multi-center neuroimaging analyses. We empirically evaluated whether a meta-analysis provides results comparable to a mega-analysis and which analytical framework performs better. Clinical interpretation of the results can be found elsewhere (Boedhoe et al., 2017b, 2018). Although effect sizes were similar for the meta-analysis and linear regression mega-analysis, lower standard errors and narrower confidence intervals of both mega-analytical approaches compared to the meta-analysis suggest better performance of the mega-analytical approach over the meta-analytical approach. While the meta-analysis failed to detect cortical thickness differences in both the adult and pediatric samples, it did support the findings of the mega-analyses at a less stringent significance threshold (p < 0.05 uncorrected). As a second aim, we investigated which mega-analytical framework was superior. The BIC values indicated a better model fit of the linear mixed-effects random-intercept model compared to the linear regression mega-analytical model.
Whereas, the linear regression model showed similar standard errors and confidence intervals to the linear mixed-effects random-intercept model, the latter fitted the data better. The effect sizes of the linear regression model appeared to be higher than those of the linear mixed-effects models, possibly indicating an overestimation of the effect of diagnosis. Indeed fixed-effects analyses (comparable to the linear regression models in our case) are reported to produce biased estimates or inflated type I error rates when pooled data includes cohorts with a small number of patients (Agresti and Hartzel, 2000; Kahan and Morris, 2012). Mathew and Nordstorm (2010) also suggested that a mega-analysis (one-stage approach) with a random intercept term might be slightly more precise than a meta-analysis (two-stage approach), which has a distinct intercept term per study (Mathew and Nordstorm, 2010). Taken together, our results suggest that the linear mixed-effects random-intercept mega-analysis model is the better approach for analyzing cortical gray matter data in a multi-center neuroimaging study.
We also explored (data not shown) a linear mixed-effects random-intercept and random-slope mega-analytical approach, since the various cohorts might have shown differences in effects of diagnosis related to clinical heterogeneity between patient samples. However, for most of the regions of interest the model did not converge. These computational difficulties and convergence problems have been reported before (Debray et al., 2013). As a result, effect sizes, confidence intervals, standard errors, and BIC values could not be estimated accurately. Indeed previous literature has demonstrated that mega-analyses may produce downwardly biased coefficient estimates when an incorrect model is specified, for instance when random effects are wrongly assumed (Dutton, 2010). Note that including a random slope in the linear mixed-effects model might be valuable when large variance is present in the data between cohorts. Therefore, we recommend the following strategy: (1) run a mixed-effects model with a random-intercept to correct for clustering of participants within cohorts; (2) add a random-slope to correct for potential variance in effects between cohorts; (3) and perform a likelihood-ratio test to statistically compare both models. If the likelihood-ratio test is significant i.e., there is a better fit of the random-intercept random-slope model, this model is preferred over the random-intercept only model. If the likelihood-ratio test is not significant i.e., there is a better fit of the random-intercept only model, this model is preferred over the random-intercept random-slope model.
Olkin and Sampson (1998) showed that for comparing treatments with respect to a continuous outcome in clinical trials, meta-analysis is equivalent to mega-analysis if the treatment effects and error variances are constant across trials. The equivalence has been extended even if the error variances are different across trials (Mathew and Nordstrom, 1999). Lin and Zeng theoretically and empirically showed asymptotic equivalence between meta- and mega-analyses when the effect sizes are the same for all studies (Lin and Zeng, 2010a,b). The different cohorts in our study did not all show similar effect sizes and error variances, possibly explaining why we did not find the meta- and mega-analyses to be equivalent. In practice, effect sizes and error variances vary across studies more often than not. Moreover, these authors (Lin and Zeng, 2010a) focused on a fixed-effects meta-analysis rather than a random-effects meta-analysis which is carried out in the current study. A fixed-effect model only takes into account the random error within cohorts, whereas the random-effect model also takes into account the random error between cohorts (Borenstein et al., 2010). Not taking into account the random error between different cohorts in neuroimaging data, for example, may lead to potentially misleading conclusions. More comprehensive simulation studies may be performed to assess theoretical differences in the results of meta- and mega-analyses. Such simulation studies covering various scenarios regarding varying effect sizes and error variances would strengthen our findings.
Conclusions of meta-analyses are often used to guide health care policy and to make decisions regarding the management of individual patients. Thus, it is important that the conclusions of meta-analyses are valid. Although the two approaches (meta- and mega-analysis) often produce similar results, sometimes clinical and/or statistical conclusions are affected (Burke et al., 2017). We agree with Burke et al. (2017) and Debray et al. (2013) that when planning IPD analyses in a multi-center setting, the choice and implementation of a mega-analysis (one-stage approach) or meta-analysis (two-stage approach) method should be pre-specified, as occasionally they lead to different conclusions. Standardized statistical guidelines addressing the best approach, such as those mentioned in Burke et al. (2017), would be beneficial in this area. For example, meta-analysis (two-stage approach) or mega-analysis (one-stage approach) may be more suitable, depending on outcome types (continuous, binary of time-to-event). In a multi-center study including multiple small sample cohorts, a mega-analysis (one-stage approach) is preferred, as it avoids the use of approximate normal sampling distributions, known within-study variances, and continuity corrections that plague mega-analysis (two-stage approach) with an inverse variance weighting. Additionally, any mega-analysis (one-stage approach) should account for the clustering of participants within cohorts, ideally by including a random-intercept term for cohort. If the effect sizes of the separate studies are expected to vary greatly, it should be investigated whether adding a random-slope to the model is beneficial. For further details about choosing an appropriate method for a multi-center study we recommend Burke et al. (2017).
To our knowledge, this is the first report investigating the utility of meta- vs. mega-analyses for multi-center structural neuroimaging data. The validity of our findings is limited to cortical gray matter measures. Therefore, they may not be generalized to all other brain measures. Nevertheless, our findings show that in the case of cross-sectional structural neuroimaging data a mega-analysis performs better than a meta-analysis. In a multi-center study with a moderate amount of variation between cohorts, a linear mixed-effects random-intercept mega-analytical framework seems to be the better approach to investigate structural neuroimaging data. We urge researchers worldwide to join forces by sharing data with the goal of elucidating biomedical problems that no group could address alone.
Ethics Statement
All subjects gave written informed consent in accordance with the Declaration of Helsinki. All local institutional review boards permitted the use of measures extracted from the coded data for meta- and mega-analysis.
Author Contributions
PB, MH, LS, OvdH, and JT contributed to the conception and design of the study. OvdH and JT contributed equally. PB organized the database. PB and MH performed the statistical analysis at the mega- and mega-analysis level. All other authors contributed to data processing and/or statistical analysis at site level. PB wrote the first draft of the manuscript. All other authors and members of the ENIGMA-OCD working group contributed to manuscript revision, read, and approved the manuscript.
Conflict of Interest Statement
The authors declare that the research was conducted in the absence of any commercial or financial relationships that could be construed as a potential conflict of interest.
Acknowledgments
DS has received research grants and/or consultancy honoraria from Biocodex, Lundbeck, and Sun in the past 3 years. The ENIGMA-Obsessive Compulsive Disorder Working-Group gratefully acknowledges support from the NIH BD2K award U54 EB020403 (PI: PT) and Neuroscience Amsterdam, IPB-grant to LS and OvdH. Supported by the Hartmann Muller Foundation (No. 1460 to SB); the International Obsessive-Compulsive Disorder Foundation (IOCDF) Research Award to PG; the Dutch Organization for Scientific Research (NWO) (grants 912-02-050, 907-00-012, 940-37-018, and 916.86.038); the Netherlands Society for Scientific Research (NWO-ZonMw VENI grant 916.86.036 to OvdH; NWO-ZonMw AGIKO stipend 920-03-542 to Dr. de Vries), a NARSAD Young Investigator Award to OvdH, and the Netherlands Brain Foundation [2010(1)-50 to OvdH]; Oxfordshire Health Services Research Committee (OHSRC) (AJ); the Deutsche Forschungsgemeinschaft (DFG) (KO 3744/2-1 to KK); the Marató TV3 Foundation grants 01/2010 and 091710 to LL; the Wellcome Trust and a pump priming grant from the South London and Maudsley Trust, London, UK (Project grant no. 064846) to DM-C; the Japanese Ministry of Education, Culture, Sports, Science, and Technology (MEXT KAKENHI No. 16K19778 and 18K07608 to TN); International OCD Foundation Research Award 20153694 and an UCLA Clinical and Translational Science Institute Award (to EN); National Institutes of Mental Health grant R01MH081864 (to JO and JP) and grant R01MH085900 (to JO and JF); the Government of India grants to YR (SR/S0/HS/0016/2011) and JN (DST INSPIRE faculty grant -IFA12-LSBM-26) of the Department of Science and Technology; the Government of India grants to YR (No.BT/PR13334/Med/30/259/2009) and JN (BT/06/IYBA/2012) of the Department of Biotechnology; the Wellcome-DBT India Alliance grant to GV (500236/Z/11/Z); the Carlos III Health Institute (CP10/00604, PI13/00918, PI13/01958, PI14/00413/PI040829, PI16/00889); FEDER funds/European Regional Development Fund (ERDF), AGAUR (2017 SGR 1247 and 2014 SGR 489); a Miguel Servet contract (CPII16/00048) from the Carlos III Health Institute to CS-M; the Italian Ministry of Health (RC10-11-12-13-14-15A to GS); the Swiss National Science Foundation (No. 320030_130237 to SW); and the Netherlands Organization for Scientific Research (NWO VIDI 917-15-318 to GvW). Further we wish to acknowledge Nerisa Banaj, Ph.D., Silvio Conte, Sergio Hernandez B.A., Yu Jin Ressal and Alice Quinton.
Supplementary Material
The Supplementary Material for this article can be found online at: https://www.frontiersin.org/articles/10.3389/fninf.2018.00102/full#supplementary-material
References
Agresti, A., and Hartzel, J. (2000). Strategies for comparing treatments on a binary response with multi centre data. Stat. Med. 19, 1115–1139. doi: 10.1002/(SICI)1097-0258(20000430)19:83.0.CO;2-X
Barnes, J., Ridgway, G. R., Bartlett, J., Henley, S. M., Lehmann, M., Hobbs, N., et al. (2010). Head size, age and gender adjustment in MRI studies: a necessary nuisance? Neuroimage 53, 1244–1255. doi: 10.1016/j.neuroimage.2010.06.025
Boedhoe, P. S., Schmaal, L., Abe, Y., Alonso, P., Ameis, S. H., Anticevic, A., et al. (2018). Cortical abnormalities associated with pediatric and adult obsessive-compulsive disorder: findings from the ENIGMA Obsessive-Compulsive Disorder Working Group. Am. J. Psychiatry 175, 453–462. doi: 10.1176/appi.ajp.2017.17050485
Boedhoe, P. S., Schmaal, L., Abe, Y., Ameis, S. H., Arnold, P. D., Batistuzzo, M. C., et al. (2017a). Distinct subcortical volume alterations in pediatric and adult OCD: a worldwide meta- and mega-analysis. Am. J. Psychiatry 174, 60–69. doi: 10.1176/appi.ajp.2016.16020201
Boedhoe, P. S., Schmaal, L., Mataix-Cols, D., Jahanshad, N., ENIGMA OCD Working Group, Thompson, P. M., et al. (2017b). Association and causation in brain imaging in the case of OCD: response to McKay et al. Am. J. Psychiatry 174, 597–599. doi: 10.1176/appi.ajp.2017.17010019r
Borenstein, M., Hedges, L. V., Higgins, J. P., and Rothstein, H. R. (2010). A basic introduction to fixed-effect and random-effects models for meta-analysis. Res. Synth. Methods 1, 97–111. doi: 10.1002/jrsm.12
Burke, D. L., Ensor, J., and Riley, R. D. (2017). Meta-analysis using individual participant data: one-stage and two-stage approaches, and why they may differ. Stat. Med. 36, 855–875. doi: 10.1002/sim.7141
de Bakker, P. I., Ferreira, M. A., Jia, X., Neale, B. M., Raychaudhuri, S., and Voight, B. F. (2008). Practical aspects of imputation-driven meta-analysis of genome-wide association studies. Hum. Mol. Genet. 17, R122–R128. doi: 10.1093/hmg/ddn288
Debray, T. P., Moons, K. G., Abo-Zaid, G. M., Koffijberg, H., and Riley, R. D. (2013). Individual participant data meta-analysis for a binary outcome: one-stage or two-stage? PLoS ONE 8:e60650. doi: 10.1371/journal.pone.0060650
Desikan, R. S., Segonne, F., Fischl, B., Quinn, B. T., Dickerson, B. C., Blacker, D., et al. (2006). An automated labeling system for subdividing the human cerebral cortex on MRI scans into gyral based regions of interest. Neuroimage 31, 968–980. doi: 10.1016/j.neuroimage.2006.01.021
Dutton, M. T. (2010). Individual Patient-Level Data Meta-Analysis: A Comparison of Methods for the Diverse Population Collaboration Data Set. Ph.D. thesis, Florida State University.
Harville, D. A. (1977). Maximum likelihood approaches to variance component estimation and to related problems. J. Am. Stat. Assoc. 72, 320–338. doi: 10.1080/01621459.1977.10480998
Ikram, M. A., Fornage, M., Smith, A. V., Seshadri, S., Schmidt, R., Debette, S., et al. (2012). Common variants at 6q22 and 17q21 are associated with intracranial volume. Nat. Genet. 44, 539–544. doi: 10.1038/ng0612-732c
Im, K., Lee, J.-M., Lyttelton, O., Kim, S. H., Evans, A. C., and Kim, S. I. (2008). Brain size and cortical structure in the adult human brain. Cereb. Cortex 18, 2181–2191. doi: 10.1093/cercor/bhm244
Kahan, B. C., and Morris, T. P. (2012). Improper analysis of trials randomised using stratified blocks or minimisation. Stat. Med. 31, 328–340. doi: 10.1002/sim.4431
Lin, D. Y., and Zeng, D. (2010a). On the relative efficiency of using summary statistics versus individual-level data in meta-analysis. Biometrika 97, 321–332. doi: 10.1093/biomet/asq006
Lin, D. Y., and Zeng, D. (2010b). Meta-analysis of genome-wide association studies: no efficiency gain in using individual participant data. Genet. Epidemiol. 34, 60–66. doi: 10.1002/gepi.20435
Mathew, T., and Nordstorm, K. (2010). Comparison of one-step and two-step meta-analysis models using individual patient data. Biometric. J. 52, 271–287. doi: 10.1002/bimj.200900143
Mathew, T., and Nordstrom, K. (1999). On the equivalence of meta-analysis using literature and using individual patient data. Biometrics 55, 1221–1223. doi: 10.1111/j.0006-341X.1999.01221.x
Nakagawa, S., and Cuthill, I. C. (2007). Effect size, confidence interval and statistical significance: a practical guide for biologists. Biol. Rev. Camb. Philos. Soc. 82, 591–605. doi: 10.1111/j.1469-185X.2007.00027.x
Olkin, I., and Sampson, A. (1998). Comparison of meta-analysis versus analysis of variance of individual patient data. Biometrics 54, 317–322. doi: 10.2307/2534018
Stewart, L. A. (1995). Practical methodology of meta-analyses (overviews) using updated individual patient data. Stat. Med. 14, 2057–2079. doi: 10.1002/sim.4780141902
Stewart, L. A., and Tierney, J. F. (2002). To IPD or not to IPD? Advantages and disadvantages of systematic reviews using individual patient data. Eval. Health Prof. 25, 76–97. doi: 10.1177/0163278702025001006
Thomas, D., Radji, S., and Benedetti, A. (2014). Systematic review of methods for individual patient data meta- analysis with binary outcomes. BMC Med. Res. Methodol. 14:79. doi: 10.1186/1471-2288-14-79
Thompson, P. M., Stein, J. L., Medland, S. E., Hibar, D. P., Vasquez, A. A., Renteria, M. E., et al. (2014). The ENIGMA Consortium: large-scale collaborative analyses of neuroimaging and genetic data. Brain Imaging Behav. 8, 153–182. doi: 10.1007/s11682-013-9269-5
Van Horn, J. D., Grethe, J. S., Kostelec, P., Woodward, J. B., Aslam, J. A., Rus, D., et al. (2001). The Functional Magnetic Resonance Imaging Data Center (fMRIDC): the challenges and rewards of large-scale databasing of neuroimaging studies. Philos. Trans. R. Soc. Lond. B Biol. Sci. 356, 1323–1339. doi: 10.1098/rstb.2001.0916
Keywords: neuroimaging, MRI, IPD meta-analysis, mega-analysis, linear mixed-effect models
Citation: Boedhoe PSW, Heymans MW, Schmaal L, Abe Y, Alonso P, Ameis SH, Anticevic A, Arnold PD, Batistuzzo MC, Benedetti F, Beucke JC, Bollettini I, Bose A, Brem S, Calvo A, Calvo R, Cheng Y, Cho KIK, Ciullo V, Dallaspezia S, Denys D, Feusner JD, Fitzgerald KD, Fouche J-P, Fridgeirsson EA, Gruner P, Hanna GL, Hibar DP, Hoexter MQ, Hu H, Huyser C, Jahanshad N, James A, Kathmann N, Kaufmann C, Koch K, Kwon JS, Lazaro L, Lochner C, Marsh R, Martínez-Zalacaín I, Mataix-Cols D, Menchón JM, Minuzzi L, Morer A, Nakamae T, Nakao T, Narayanaswamy JC, Nishida S, Nurmi EL, O'Neill J, Piacentini J, Piras F, Piras F, Reddy YCJ, Reess TJ, Sakai Y, Sato JR, Simpson HB, Soreni N, Soriano-Mas C, Spalletta G, Stevens MC, Szeszko PR, Tolin DF, van Wingen GA, Venkatasubramanian G, Walitza S, Wang Z, Yun J-Y, ENIGMA-OCD Working- Group, Thompson PM, Stein DJ, van den Heuvel OA and Twisk JWR (2019) An Empirical Comparison of Meta- and Mega-Analysis With Data From the ENIGMA Obsessive-Compulsive Disorder Working Group. Front. Neuroinform. 12:102. doi: 10.3389/fninf.2018.00102
Received: 15 August 2018; Accepted: 13 December 2018;
Published: 08 January 2019.
Edited by:
Xi-Nian Zuo, Institute of Psychology (CAS), ChinaReviewed by:
Feng Liu, Tianjin Medical University General Hospital, ChinaNeil R. Smalheiser, University of Illinois at Chicago, United States
Copyright © 2019 Boedhoe, Heymans, Schmaal, Abe, Alonso, Ameis, Anticevic, Arnold, Batistuzzo, Benedetti, Beucke, Bollettini, Bose, Brem, Calvo, Calvo, Cheng, Cho, Ciullo, Dallaspezia, Denys, Feusner, Fitzgerald, Fouche, Fridgeirsson, Gruner, Hanna, Hibar, Hoexter, Hu, Huyser, Jahanshad, James, Kathmann, Kaufmann, Koch, Kwon, Lazaro, Lochner, Marsh, Martínez-Zalacaín, Mataix-Cols, Menchón, Minuzzi, Morer, Nakamae, Nakao, Narayanaswamy, Nishida, Nurmi, O'Neill, Piacentini, Piras, Piras, Reddy, Reess, Sakai, Sato, Simpson, Soreni, Soriano-Mas, Spalletta, Stevens, Szeszko, Tolin, van Wingen, Venkatasubramanian, Walitza, Wang, Yun, ENIGMA-OCD Working-Group, Thompson, Stein, van den Heuvel and Twisk. This is an open-access article distributed under the terms of the Creative Commons Attribution License (CC BY). The use, distribution or reproduction in other forums is permitted, provided the original author(s) and the copyright owner(s) are credited and that the original publication in this journal is cited, in accordance with accepted academic practice. No use, distribution or reproduction is permitted which does not comply with these terms.
*Correspondence: Odile A. van den Heuvel, oa.vandenheuvel@vumc.nl
Jos W. R. Twisk, jwr.twisk@vumc.nl
†See Consortium List excel file in the Supplementary Material for the complete list of ENIGMA-OCD working group members
‡These authors have contributed equally to this work